

Introduction
In today’s digital business environment, companies generate huge amounts of data every day. Information from sales, marketing, finance, customer interactions, and operations can help businesses make better decisions, but only when it is properly organized and analyzed.
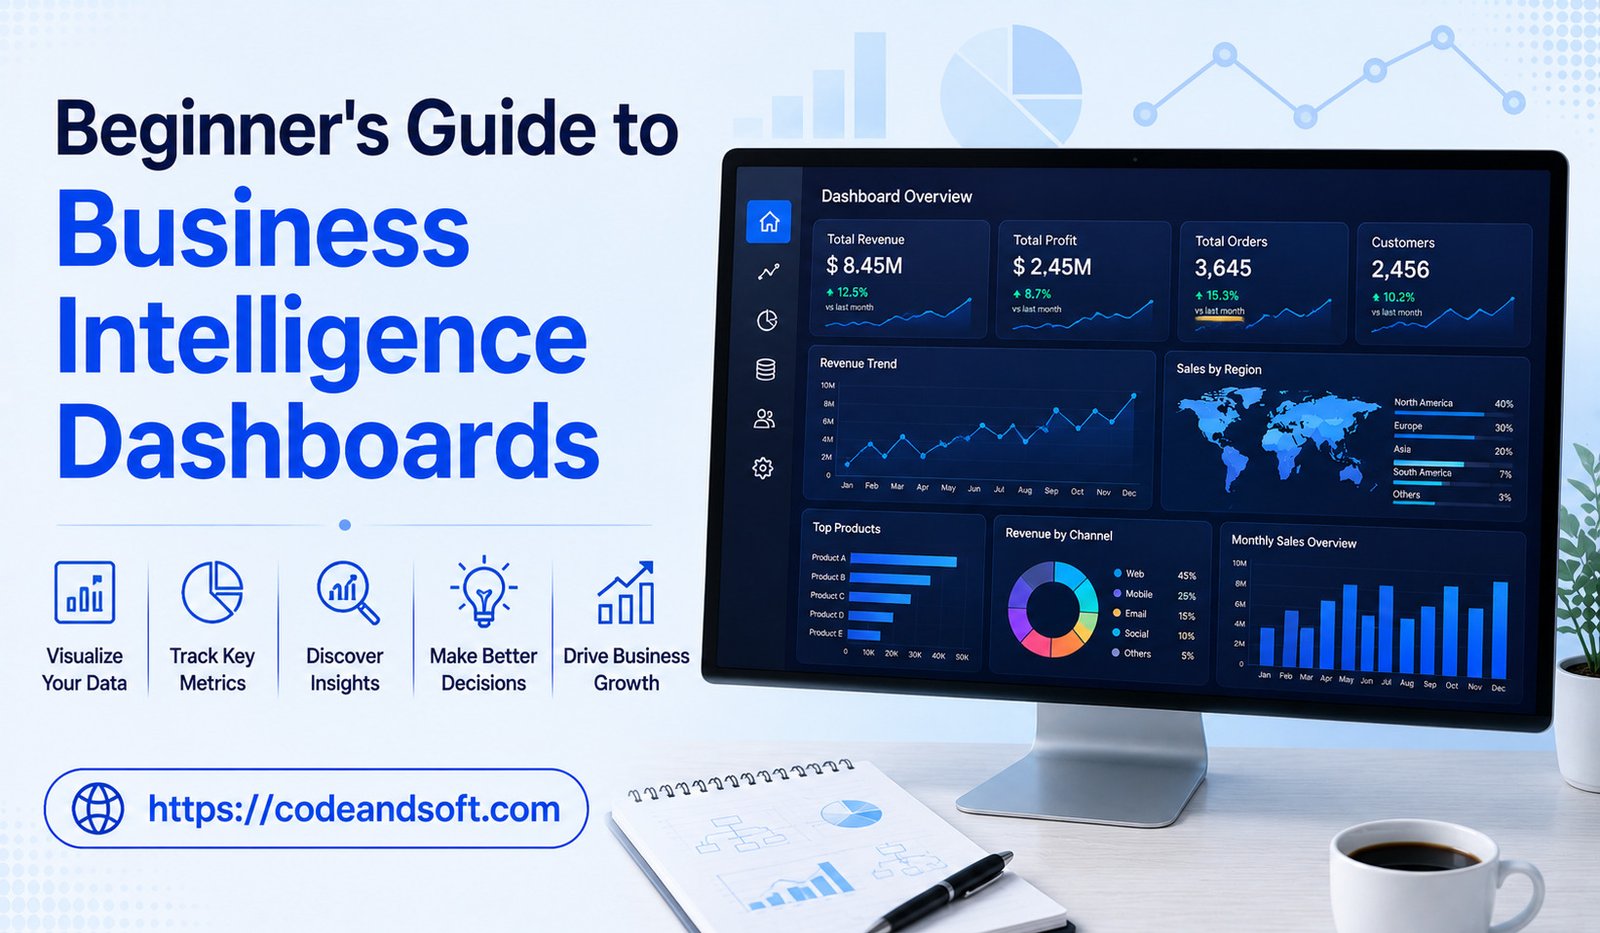
This is where Business Intelligence (BI) dashboards play an important role. BI dashboards transform complex business data into simple visual displays that help users understand performance, identify trends, and make informed decisions quickly.
Earlier, businesses depended on spreadsheets and manual reports to track performance. These methods often required significant time and effort, making it difficult to access real-time insights. Modern BI dashboards provide a centralized view of important business information through charts, graphs, metrics, and interactive reports.
For beginners, understanding BI dashboards is the first step toward building a data-driven business strategy. This guide explains what BI dashboards are, how they work, their benefits, key features, and how businesses can use them effectively.
What Is a Business Intelligence Dashboard?
A Business Intelligence dashboard is a visual tool that displays important business data in an easy-to-understand format. A BI dashboard helps users monitor business activities without manually analyzing large amounts of data.
For example, a sales dashboard can show:
- Monthly revenue
- Number of new customers
- Sales growth percentage
- Best-performing products
- Regional sales performance
Instead of reviewing multiple reports, managers can view all important information in one place.
How Do Business Intelligence Dashboards Work?
BI dashboards work by collecting, processing, and presenting data from different business systems.
The basic process includes:
1. Data Collection
The dashboard connects with various data sources, such as:
- Customer relationship management systems
- Accounting software
- Marketing platforms
- Sales databases
- Enterprise applications
- Cloud storage systems
2. Data Processing
The BI platform organizes and analyzes collected information. It removes unnecessary data, identifies patterns, and prepares information for visualization.
3. Data Visualization
The processed data is displayed through visual elements such as:
- Charts
- Graphs
- Tables
- Maps
- Key performance indicators (KPIs)
4. Insight Generation
Users analyze the dashboard information to understand performance and make business decisions.
Why Business Intelligence Dashboards Are Important
BI dashboards help businesses move from guess-based decisions to data-driven strategies.
Some major reasons why companies use BI dashboards include:
Faster Decision-Making
Dashboards provide quick access to important information, allowing managers to make faster decisions.
Instead of waiting for reports from different departments, leaders can immediately understand business performance.
Better Data Understanding
Large datasets can be difficult to analyze manually. Dashboards simplify information by presenting it visually.
A graph showing sales growth is easier to understand than thousands of rows in a spreadsheet.
Improved Business Monitoring
BI dashboards allow businesses to track important metrics continuously.
Companies can monitor:
- Revenue
- Expenses
- Customer satisfaction
- Employee performance
- Marketing results
Increased Productivity
Automated dashboards reduce the time employees spend preparing reports.
Teams can focus more on analyzing insights and improving business strategies.
Types of Business Intelligence Dashboards
Different businesses use different types of dashboards based on their goals.
1. Strategic Dashboards
Strategic dashboards are designed for business leaders and executives. They provide a high-level overview of company performance.
They usually focus on long-term goals and important business objectives.
Examples:
- Revenue growth
- Market performance
- Business expansion
- Overall profitability
2. Operational Dashboards
Operational dashboards help teams monitor daily activities and performance.
They provide real-time information about ongoing business operations.
Examples:
- Daily sales
- Inventory levels
- Customer support requests
- Production performance
3. Analytical Dashboards
Analytical dashboards help users study trends and patterns in data.
They are commonly used by analysts and managers who need detailed insights.
Examples:
- Customer behavior analysis
- Sales forecasting
- Market research
- Performance comparisons
Key Components of a BI Dashboard
A good BI dashboard includes several important elements.
Key Performance Indicators (KPIs)
KPIs are measurable values that show business performance.
Examples include:
- Revenue growth rate
- Customer acquisition rate
- Profit margin
- Conversion rate
KPIs help users quickly understand whether business goals are being achieved.
Data Visualizations
Visual elements make complex information easier to understand.
Common visualization types include:
- Bar charts
- Line graphs
- Pie charts
- Heat maps
- Geographic maps
Filters and Interactive Features
Interactive dashboards allow users to explore data by applying filters.
For instance, users can analyze sales information according to:
- Region
- Product category
- Time period
- Customer group
Automated Reports
Many BI dashboards can automatically create reports and provide timely updates, helping businesses reduce the effort required for manual reporting.
Benefits of Business Intelligence Dashboards
1. Provides Real-Time Insights
One of the biggest advantages of BI dashboards is access to updated information.
Businesses can quickly identify changes in:
- Sales performance
- Customer behavior
- Market trends
- Financial results
Real-time insights help companies respond faster.
2. Improves Business Performance
Dashboards help organizations identify strengths and weaknesses.
For example, a company may discover that one product category is performing better than others and adjust its strategy accordingly.
3. Enhances Collaboration
BI dashboards allow different departments to access the same information.
Sales, marketing, finance, and operations teams can work with a shared understanding of business performance.
4. Helps Identify Problems Early
Dashboards can highlight unusual changes or performance issues.
For example:
- Sudden revenue decline
- Increased customer complaints
- Rising operational costs
Early detection allows businesses to take corrective action.
5. Supports Data-Driven Culture
When employees have access to reliable data, they become more confident in making decisions based on facts.
BI dashboards encourage organizations to build a data-driven workplace.
Popular Business Intelligence Dashboard Tools
Several BI platforms help businesses create powerful dashboards.
Microsoft Power BI
Microsoft Power BI is a widely used BI platform that allows businesses to create interactive dashboards and reports.
It provides:
- Data visualization
- Business analytics
- AI-powered insights
- Data integration
Power BI is popular among businesses of different sizes because of its flexibility.
Tableau
Tableau is known for its advanced data visualization capabilities.
It helps organizations create interactive dashboards that make complex data easier to understand.
Google Looker
Google Looker provides cloud-based analytics and dashboard solutions for businesses that need centralized data management.
Zoho Analytics
Zoho Analytics offers affordable BI dashboard solutions for small and medium-sized businesses.
It provides reporting, visualization, and data analysis features.
How Businesses Use BI Dashboards
Sales and Marketing
Companies use dashboards to track:
- Sales growth
- Customer acquisition
- Campaign performance
- Conversion rates
Marketing teams can identify which campaigns generate the best results.
Finance
Financial dashboards help businesses monitor:
- Revenue
- Expenses
- Profit margins
- Cash flow
They support better budgeting and financial planning.
Human Resources
HR teams use dashboards to analyze:
- Employee performance
- Hiring trends
- Workforce data
- Employee retention
Customer Service
Customer support dashboards track:
- Response times
- Customer satisfaction
- Complaint trends
- Support performance
Inventory Management
Businesses use dashboards to monitor:
- Stock levels
- Product demand
- Supply chain performance
How to Create an Effective BI Dashboard
Creating a useful dashboard requires careful planning.
Define Clear Objectives
Before building a dashboard, businesses should decide what information they need.
For example:
- Improve sales performance
- Track financial health
- Understand customers
Choose Important Metrics
Avoid adding unnecessary information. Focus on metrics that support business goals.
Keep the Design Simple
A good dashboard should be easy to understand. Too many charts and numbers can make information confusing.
Use Appropriate Visualizations
Different types of data require different visual formats.
For example:
- Trends are better shown with line charts
- Comparisons work well with bar charts
- Geographic data can use maps
Update Data Regularly
Dashboards should provide accurate and updated information.
Common Mistakes to Avoid When Using BI Dashboards
Adding Too Much Information
A dashboard overloaded with data can become difficult to use.
Tracking Irrelevant Metrics
Businesses should focus only on metrics connected to their goals.
Ignoring User Needs
Dashboards should be designed based on who will use them.
Poor Data Quality
Incorrect data can lead to incorrect decisions.
Conclusion
Business Intelligence dashboards have become essential tools for organizations that want to make smarter decisions using data. They simplify complex information, provide real-time insights, and help businesses monitor performance effectively.
For beginners, understanding BI dashboards is an important step toward building a data-driven approach. Whether tracking sales, managing finances, improving customer service, or analyzing operations, dashboards provide valuable insights that support business growth.
As artificial intelligence and automation continue to improve, BI dashboards will become even more powerful, helping businesses predict trends, solve problems, and make better decisions in the future.