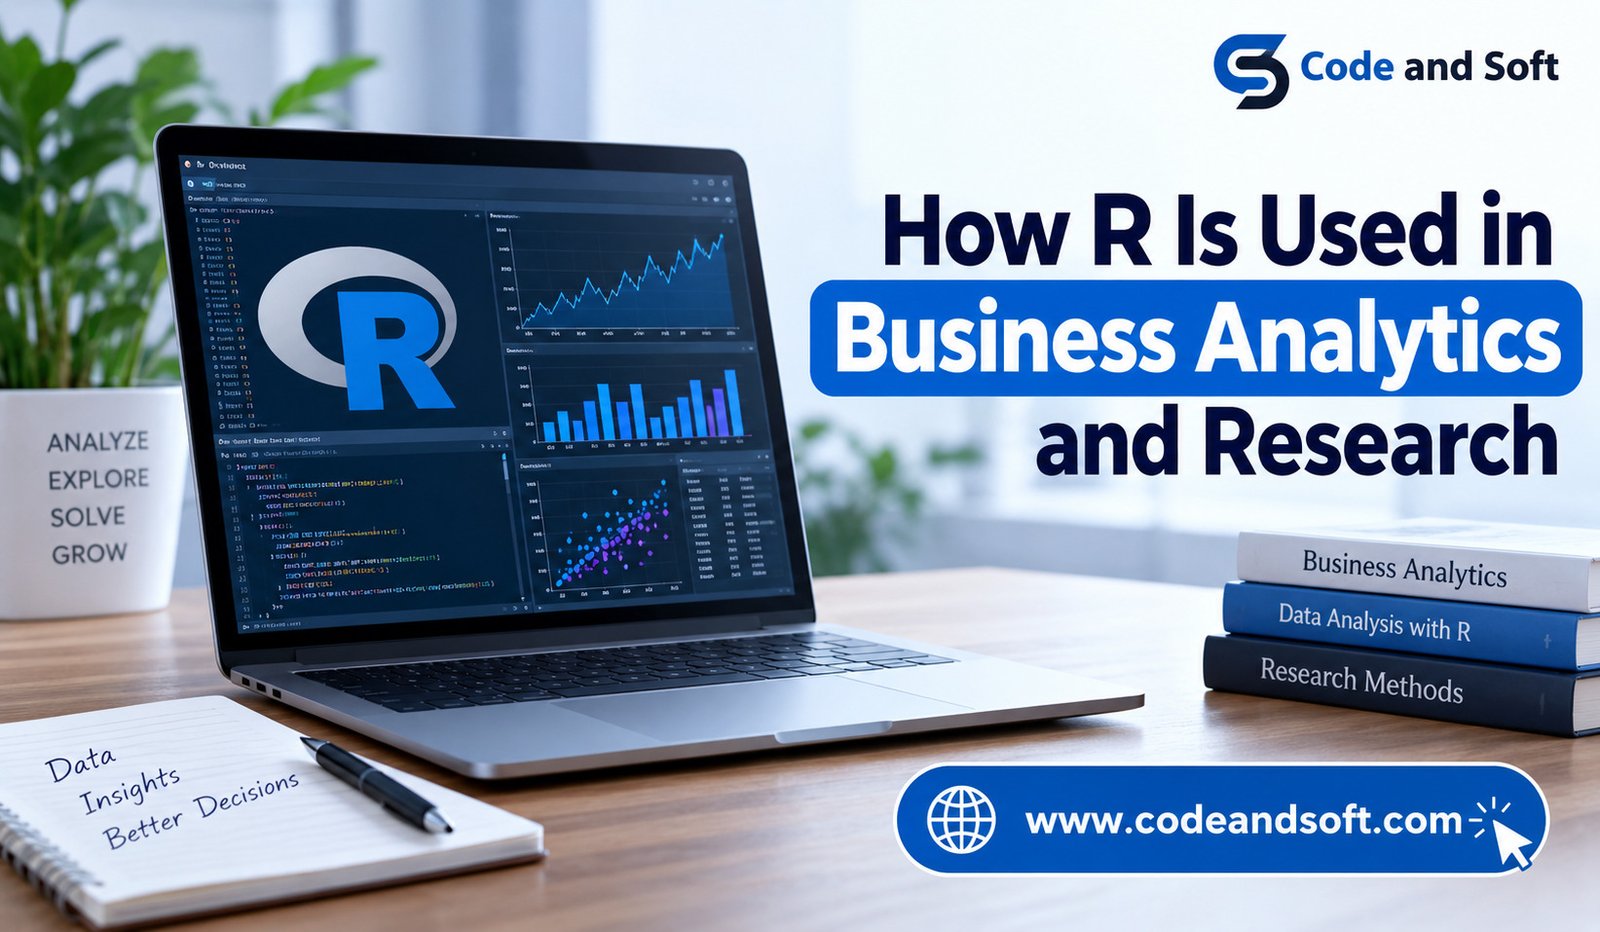

R has become a popular programming language for working with data, especially in business analytics and research. Companies, universities, research teams, and independent analysts use R to understand large amounts of information, find useful patterns, create charts, and support better decisions.
One reason R is widely used is that it was built with data work in mind. Instead of depending only on spreadsheets or manually checking large amounts of information, users can use R to organize, study, and present data more efficiently. It can work with sales records, customer information, survey responses, financial figures, website activity, scientific results, and many other types of data.
R is also useful for people who need to repeat the same type of analysis regularly. Once a process has been written in R, it can be run again when new data becomes available. This can save time and reduce the chances of mistakes.
What Is R?
R is a programming language and software environment mainly used for statistics, data analysis, and research. It is available for free and can be used on common operating systems.
R allows users to bring data into a computer, clean it, study it, create charts, and produce reports. It can handle both small datasets and very large collections of information.
Although R is a programming language, users do not always need to be experienced programmers to get started. Many learning resources and ready-made tools are available, making it easier for beginners to understand the basics.
R is especially strong when the work involves numbers, comparisons, trends, surveys, predictions, or research results. This makes it useful across many industries.
Why Businesses Use R
Modern businesses create huge amounts of data every day. A company may collect information about sales, customers, advertising campaigns, products, website visits, and employee performance. Looking at all this information manually can be difficult.
R helps businesses turn this raw information into something easier to understand.
For example, a retail company can use R to study its sales records. It can compare sales from different months, identify products that are selling well, and examine changes in customer buying habits. A marketing team can use similar information to understand which campaigns are bringing more customers.
R can also help businesses answer questions that are difficult to solve by simply looking at a spreadsheet. Instead of asking only, “How many products did we sell?”, a company can explore why sales increased, whether certain customers are more likely to buy a product, and what may happen if current trends continue.
This makes R useful not only for looking at what happened in the past but also for supporting future business decisions.
R in Business Analytics
Business analytics involves studying information to help companies make better decisions. R can support many parts of this process.
One common use is examining sales data. A business can use R to compare sales across different locations, products, customer groups, or periods. Charts can make these comparisons easier to understand.
For example, imagine a company that sells clothing online. The company may have several years of order information. Using R, an analyst can examine which products are most popular, when customers usually place orders, and whether certain products perform better during particular seasons.
R can also help businesses understand customers. Companies often collect information through purchases, surveys, websites, and mobile applications. R can help analyze this information to identify common customer behaviors.
This can help a business improve its products, pricing, advertising, and customer service.
Another important use is measuring business performance. A company may want to know whether revenue is growing, whether costs are increasing, or whether a new product is performing better than an older product. R can process these numbers and create clear charts that show changes over time.
R for Market Research
Market research is another area where R can be extremely useful. Before launching a product or changing a service, companies often want to know what customers think.
Businesses may conduct surveys and collect thousands of responses. Reading every response manually can take a great deal of time, particularly when the survey contains many questions.
R can help researchers organize survey information and study the answers. It can show how customers responded to different questions and whether opinions vary between different groups.
For example, a company planning to launch a new smartphone might survey customers about price, battery life, camera quality, design, and other features. R can help the research team understand which features matter most to potential buyers.
This information can then support decisions about product design and marketing.
R in Research
R is widely used in academic and scientific research because researchers often need to work with numbers and large amounts of collected information.
A researcher may conduct an experiment, collect measurements, and then use R to examine the results. R can help compare different groups and show whether the differences found in the research are meaningful.
For example, a university researcher studying education might collect test scores from students who used two different teaching methods. R can help compare the results and create charts that show how the groups performed.
Researchers in fields such as economics, psychology, biology, medicine, environmental studies, sociology, and agriculture also use R for different types of data work.
The exact research question may change from one field to another, but the basic need remains similar: collect information, study it carefully, and communicate the findings clearly.
Cleaning and Preparing Data With R
Before data can be properly studied, it often needs to be cleaned. Real-world data is rarely perfect.
A business database might contain missing values, duplicate records, incorrect spellings, or numbers stored in the wrong format. A research survey might have incomplete answers or inconsistent information.
R can help users find and correct many of these problems. It can also change data into a format that is easier to study.
For example, if one part of a customer database records “India” while another uses “IN,” an analyst can use R to bring these values into a consistent format. Similar changes can be made to dates, numbers, names, and other information.
This preparation is important because poor-quality data can lead to poor conclusions. R helps make the process more organized and repeatable.
Creating Charts and Reports
Numbers are often easier to understand when they are shown visually. R is well known for its ability to create charts and graphs.
A business analyst can use R to create charts showing monthly sales, customer growth, product performance, or website traffic. Researchers can create charts to show experiment results, survey responses, or changes over time.
These visuals can make reports easier for other people to understand. A manager may not want to read through thousands of rows of data, but a clear chart can quickly show whether sales are rising or falling.
R also gives users control over how charts are presented. Titles, labels, sizes, and other parts of a chart can be adjusted to make the final result clearer.
R for Predicting Future Results
Businesses and researchers are often interested in what could happen next. R can be used to study past information and create estimates about future results.
For example, a company may have several years of sales data and want to estimate future demand. R can study previous sales patterns and help create a forecast.
A retailer might use this information when planning how much stock to keep. A financial team could use it when preparing business plans. A university researcher might use past research results to estimate possible future outcomes.
These predictions are not guarantees. Future events can change because of many factors. However, studying existing information can provide useful guidance when making plans.
R and Large Amounts of Data
Businesses and research organizations can collect much more information than they could a few decades ago. This creates a need for tools that can work with large datasets.
R can handle large amounts of structured data and can connect with other data systems. This allows analysts to work with information without relying entirely on manual spreadsheet work.
For example, an online business may collect thousands or millions of records about customer visits and purchases. R can be used to study this information and find patterns that may not be obvious from a small sample.
The ability to repeat analysis is another advantage. If a company receives new data every week, the same R process can often be used again rather than starting from the beginning.
R Compared With Spreadsheets
Spreadsheets remain very useful in business, especially for simple calculations, budgets, and smaller datasets. However, they can become difficult to manage when the amount of data or the number of steps increases.
R offers a different approach. Instead of manually repeating each action, users can write instructions that tell R exactly what should happen.
This makes the work easier to repeat. It also creates a record of how the analysis was completed. If another analyst needs to check the work later, they can review the R code and understand the process.
For research, this can be particularly helpful because researchers often need to explain how they reached their results.
R Is Useful Across Different Industries
R is not limited to one type of business. Its use can be found across many industries because almost every organization works with data.
Banks can use R to study financial information and customer behavior. Retail companies can examine sales and purchasing patterns. Marketing teams can measure campaign results. Manufacturers can study production information. Universities can analyze student data and research results.
Government organizations and nonprofit groups can also use R when working with surveys, public information, and research projects.
The flexibility of R is one of its biggest strengths. The same basic tool can be adapted to many different questions.
Learning R for Business and Research
People who are new to R do not need to learn everything at once. The best approach is usually to begin with basic data handling and simple charts.
After becoming comfortable with the basics, users can learn how to work with larger datasets and more advanced forms of analysis.
It is also helpful to learn R through real examples. Someone working in marketing might practice with advertising data, while a student could use survey or research data. Learning through familiar examples makes the language easier to understand.
R has a large community of users, so many tutorials, guides, examples, and learning materials are available online.
The Future of R in Analytics and Research
As organizations continue to collect more information, the need for practical data tools is likely to remain strong. R has already become an important part of many business and research workflows.
Its ability to organize data, perform calculations, create visuals, and support research makes it useful for both experienced analysts and people who are beginning to work with data.
R is also part of a wider data-focused environment. It can work alongside databases, spreadsheets, other programming languages, and modern data tools. This means users do not have to treat R as a separate system. It can become one part of a larger process.
Conclusion
R is widely used in business analytics and research because it makes working with data more organized and efficient. Businesses can use it to understand sales, customers, marketing results, and performance. Researchers can use it to study experiments, surveys, and collected information.
Its ability to clean data, create clear charts, repeat analysis, and work with large datasets makes it a valuable tool in many fields. While learning any programming language takes some practice, beginners can start with simple tasks and gradually build their skills.
For anyone who regularly works with numbers, surveys, research information, or business data, learning R can be a useful step toward making that information easier to understand and use.